|
|
|
Friday 18 July 2003
Education
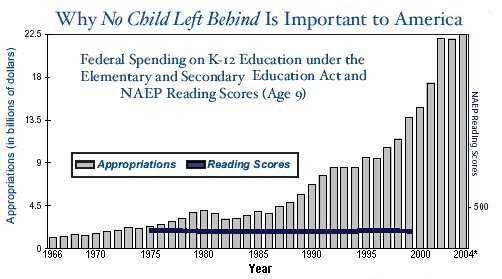
Education Spending and Performance There has been some discussion (here and here among other places about a chart that currently graces the front of the Department of Education’s website. For your convenience, here is the chart:
This looks pretty damning, and it appears to confirm what we all believe to be true (or what I believe to be true, anyway): that expenditures on education don’t have much to do with results. Education isn’t an inherently expensive process. In fact, usually, the more money spent on primary education, the worse the results. This isn’t because money sucks knowledge out of the heads of children, but because most school systems, when faced with problems, throw money at them. The worse your problems, the more money you’re going to try to throw at them. So education spending has risen — though not as much as you’d think from that incredibly bad chart. To begin with, since test performance has only fluctuated within a three-point range, there’s no need to give the only tick mark on the test-score axis the value of ‘500’, putting the test score line way down at the bottom of the chart. And second, these expenditures are not adjusted for inflation. If we convert everything to 2003 dollars, the spending for 1975-2003 looks like this:
It doesn’t look as bad now (except, amazingly, from 2002-2003), but in real terms one type of education spending has indeed risen, while one measure of educational performance has not. 9-year-old students in 1975 scored 210 on a reading test; in 1999, they scored 212. It’s a dead heat. And that’s what nobody seems to be talking about. If we assume that the test is valid and that it didn’t change radically between 1975 and 1999, students throughout those years had the same performance. Ford, Carter, Reagan, Bush, Clinton, and the current Bush, and their Secretaries of Education, don’t appear to have had much influence on things either way. The average child born in 1990 appears to have been able to read, at age 9, just as well as the average child born in 1966 could. If you go by what politicians and newspapers have to say, we’re in a constant crisis of education. I have never read any assessment of education that didn’t lament how much dumber kids were than they were in the assessor’s salad days, thirty or so years ago. In 1890, people were saying this. In 1950, in 1960, in 1970, and so on. Our schools are, it would seem, turning out generation after generation of dullards, unable to read or do simple arithmetic. Nobody can find the United States on a map, and nobody’s quite sure of when the Civil War was fought, or why. Yet somehow, the Ship of State has sailed on. This is why I’m almost infinitely skeptical of any claims of failure of, or imminent failure of, any education system. Some schools are better than others, and some teachers, as we all know, are better than others. But the simple fact is that this has always been the case. It’s probably possible to eliminate or improve some of the worst teachers and schools, and to eliminate or decrease the apathy (or hostility) toward education that you find in the cultures of the very worst students, and in so doing make us a smarter nation. A failure to do so, though, will not result in society going down the tubes. Posted by tino at 21:17 18.07.03This entry's TrackBack URL::
http://tinotopia.com/cgi-bin/mt3/tinotopia-tb.pl/168 Links to weblogs that reference 'Education Spending and Performance' from Tinotopia. Comments
I would be interested in seeing your inflation-adjusted numbers further adjusted for the number of students. Posted by: RRP at July 19, 2003 01:54 PM Disclaimer: I don’t want to sound like a shill for the education establishment. That having been stated, the requirements to graduate from high school in the 1890s were much more rigourous than they are currently. One can see this as the “dumbing down” of America, and decide that money must be thrown at the issue. Or, one can look at the broader picture, the fact that, after eighth grade, school becomes little more than a four-year prison term for many students. Not that this is always a bad thing, but it does come at some price. If, when I was 14, I had the choice to get a full-time job or go to school, I probably would have taken the full-time job. However, because of how the system is structured, I couldn’t drop out of school until I was 16, at which point, what’s two more years? I worked as many hours as I legally could (and a good number of illegal ones) during my high school tenure. Schoolwork slacked from a combination of apathy and exhaustion; consequently, despite my high SAT scores, I couldn’t get into a top-tier school even if I could pay for it. (Interestingly enough, an 18 year-old middle class black student with the same GPA and SAT scores would probably get bonus points from Ivy League admissions boards for “life experience”, whereas I, a 21 year-old white veteran, with real-world life experience, would not.) I don’t think throwing more money at schools is going to help anything. The school district I live in now spends about $10K per student per year, and their scores are only marginally better than districts that spend less. If teacher/student ratios were so important, then why isn’t this an issue in college, where 300 students in a section of Psych 101 is commonplace? I guess my point is that a high school diploma demonstrates the ablilty to get through 13 years of indoctrination without being expelled. I picked up some useful skills, but very few of them during my last three years. Posted by: Twonk at July 21, 2003 09:55 AM I thought of adjusting for the number of students, but I could not find decent numbers for the school population over the years. There’s a general trough in the 1980s (when generation X, a relatively small cohort, was in school) and a rise in the 1990s (when the very numerous children of Boomers were in school), though, so my guess is that factoring in the number of students makes the graph even flatter. These numbers measure only one kind of spending by the federal government; they say nothing at all about other money from Washington, or money from state, county, and city governments; most of the increase in education spending has come from most local sources of funds. Posted by: Tino at July 21, 2003 03:42 PM |